Is to provide you with reporting and analysis that will help you to visualize the performance of your business and to find, where possible, insights that will help you improve your business.
We'll do what we do best - reporting and analysis - freeing up your time to do what you do best - running your business.
Business Intelligence
We can help you extract the value hidden in your data and are here to help whether you need one time analysis or recurring reporting and analysis.
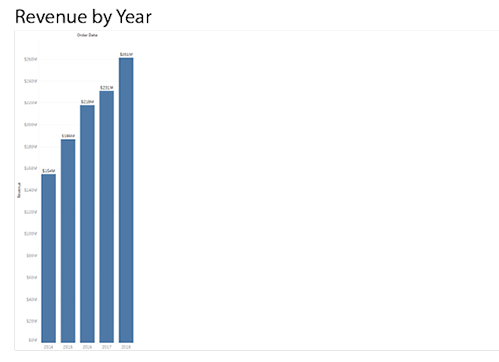
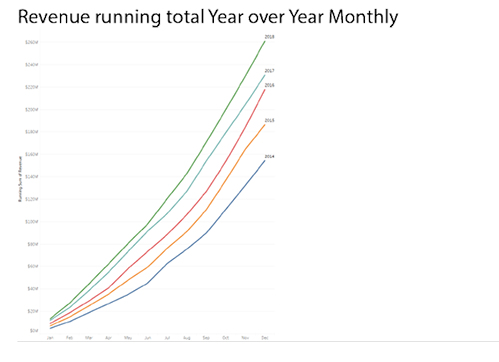
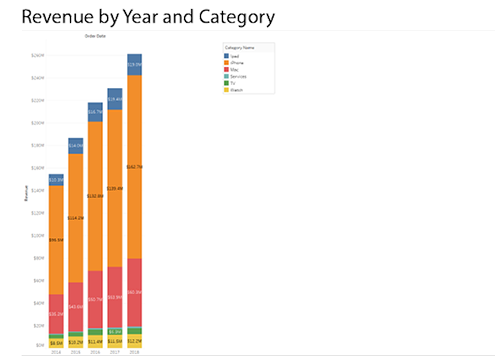
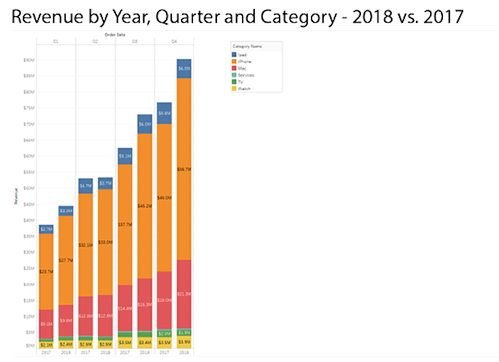
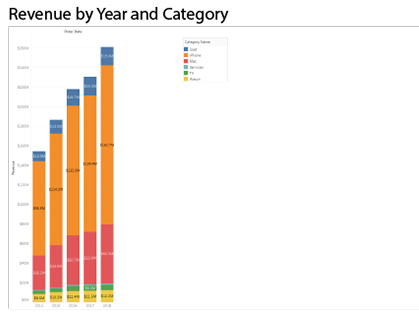
Business Intelligence reporting and analysis with lots of visualizations can help your business rapidly discover the hidden value in your data.
By taking actions based on those discoveries you can lower expenses and increase revenue, resulting in higher profits. You can also gain a competitive advantage over your competition.
Sales, Marketing, Operations, Finance, Customer Service, etc. - the efficiency of all areas of your business can be improved with careful reporting and analysis.
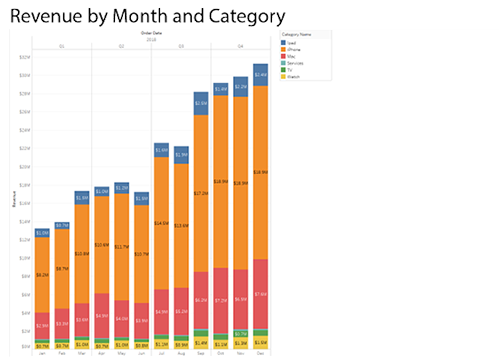
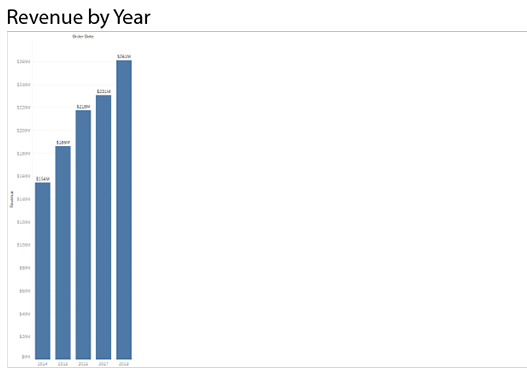
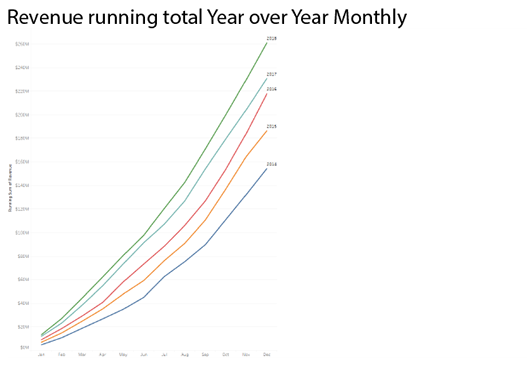
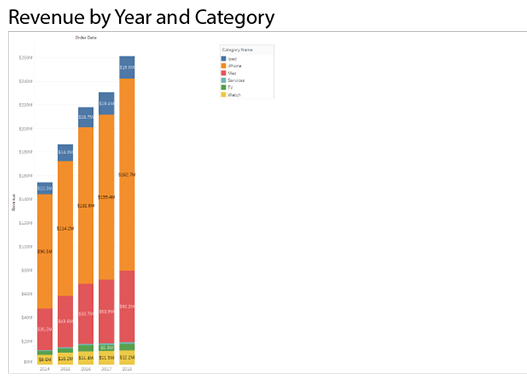
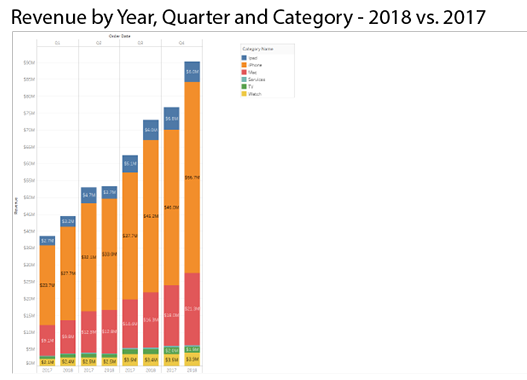
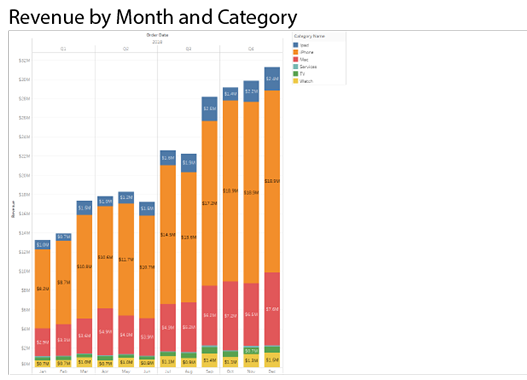
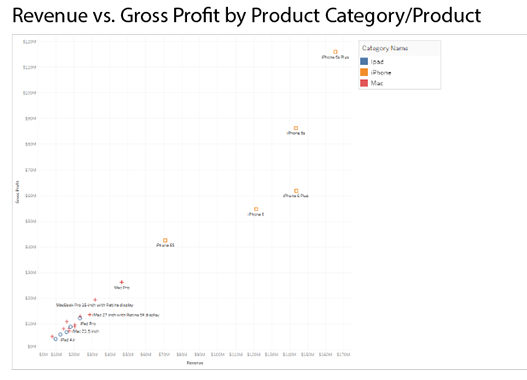
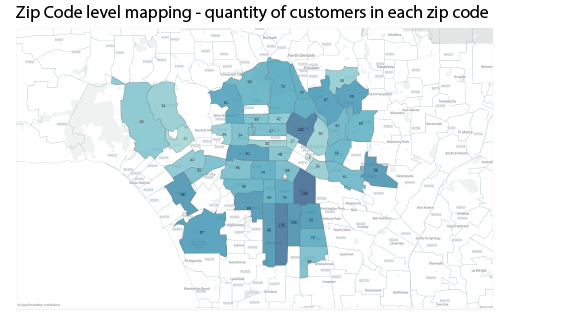
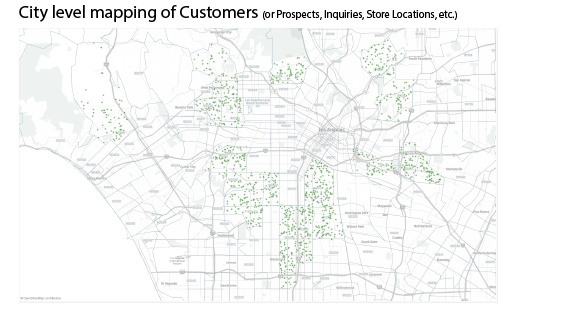
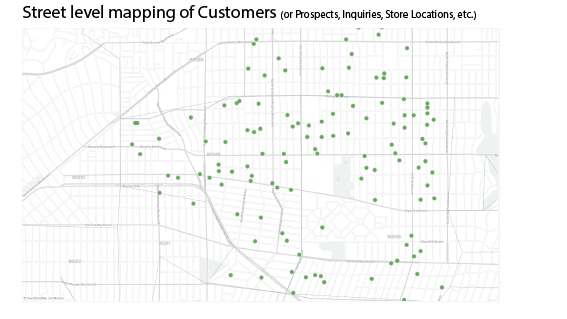
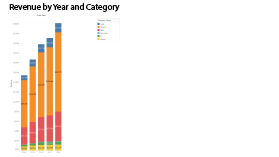
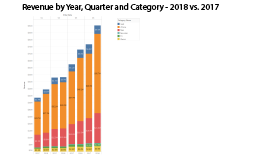
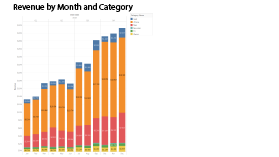
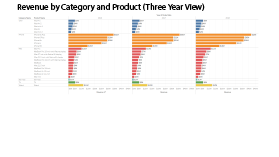
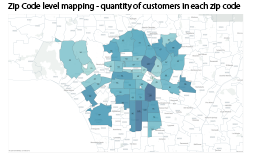
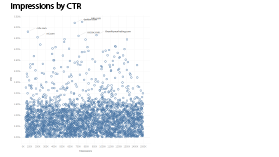
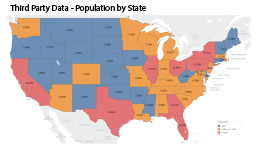
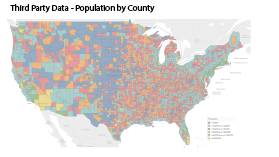
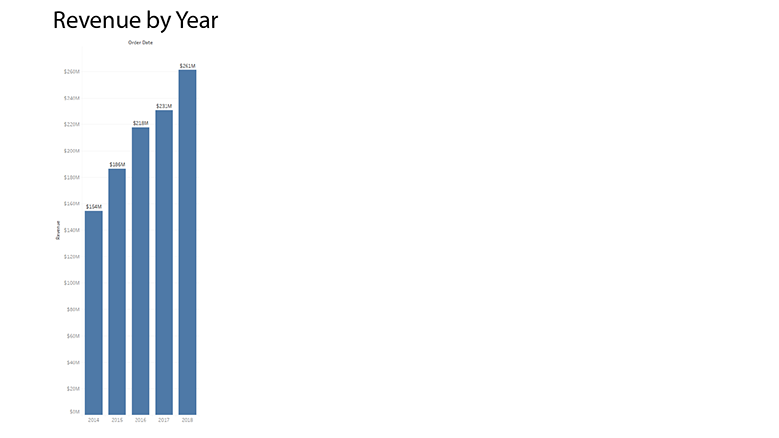
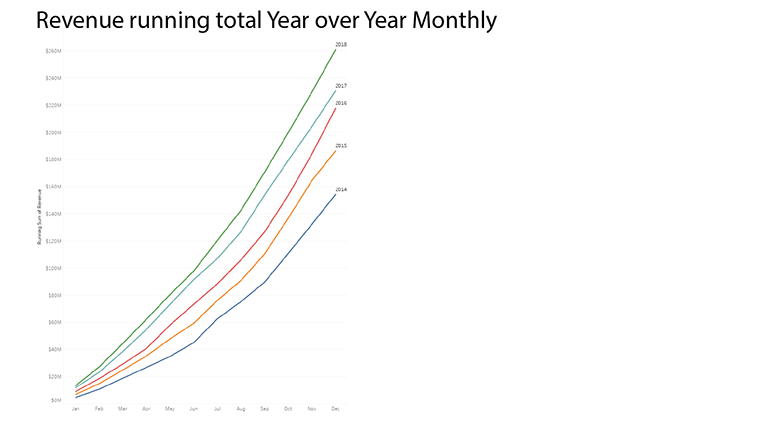
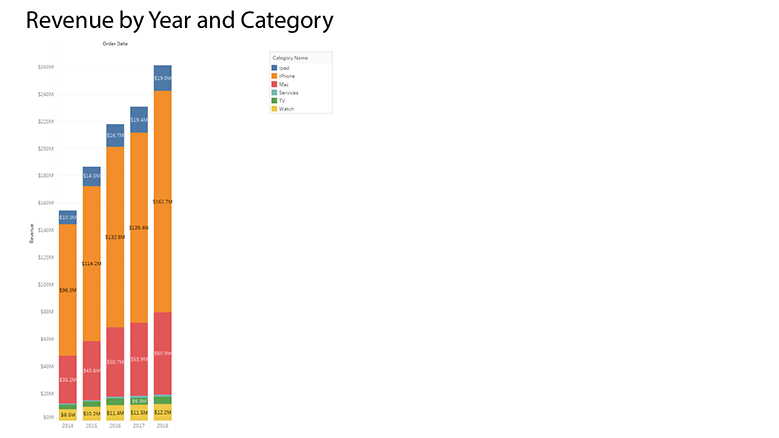
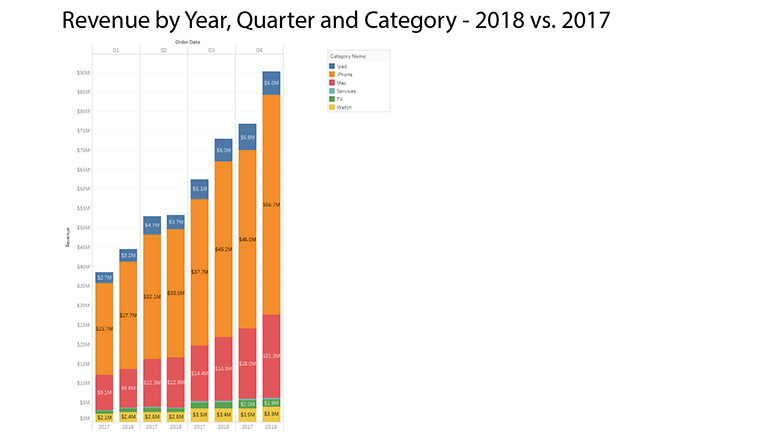
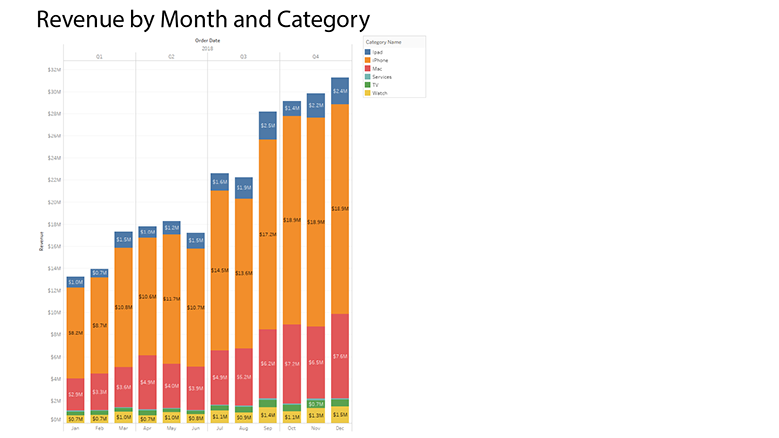
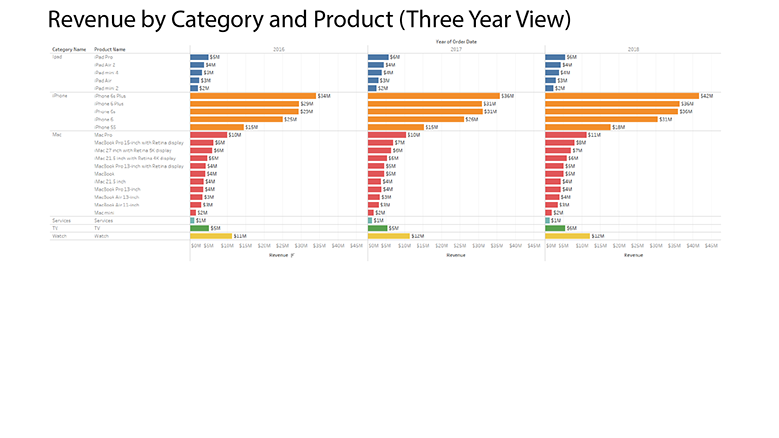
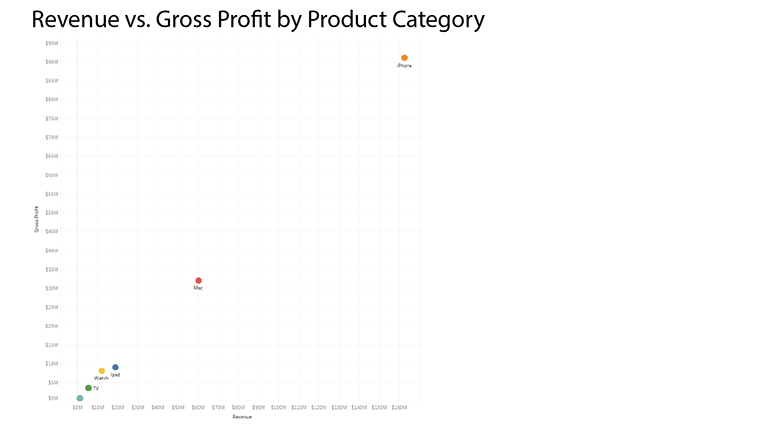
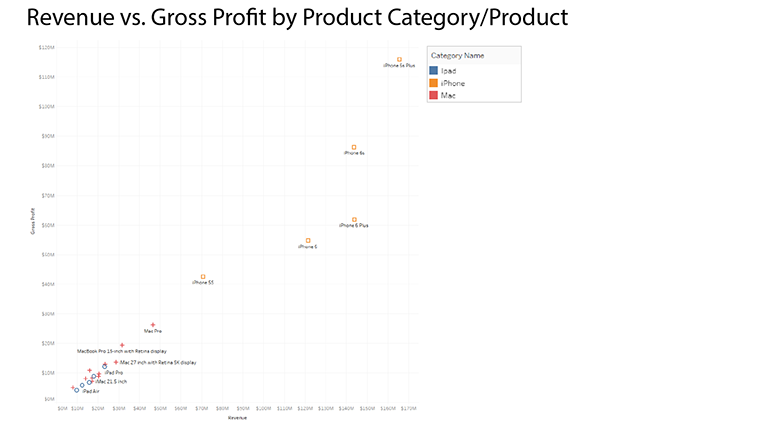
The old saying that "A picture is worth a thousand words" is absolutely true. A corollary saying in business might be that "A chart is worth a million, or a billion rows of data". It is far easier to identify opportunities hidden in data through data visualizations.

We will work with you to design your reports and send them to you as often as you need them.


A general overview of options is shown down below.
We will work closely with you to develop the
reporting and analysis necessary to help you run your business.
what reports /Charts / Analysis do you need?
what charts reveal the patterns in the data?
How often would you like to receive your reports?
- Sales
- Marketing
- Operations
- Customer Service
- Ad hoc
- Recurring or one-time
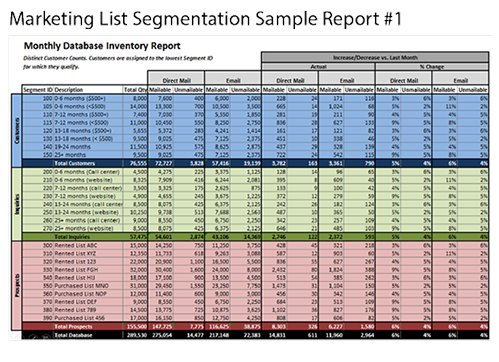
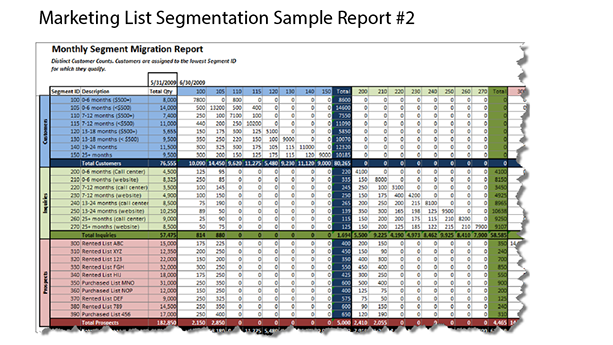
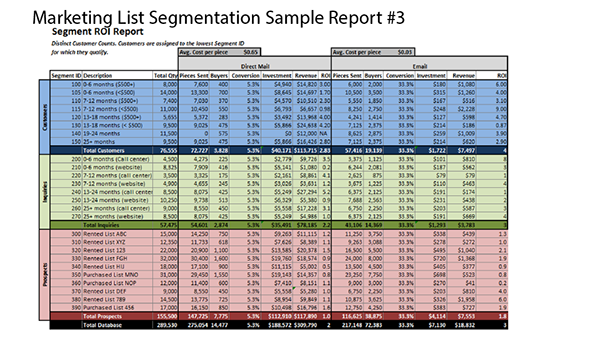
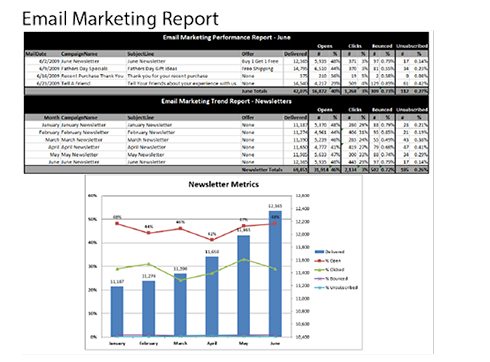
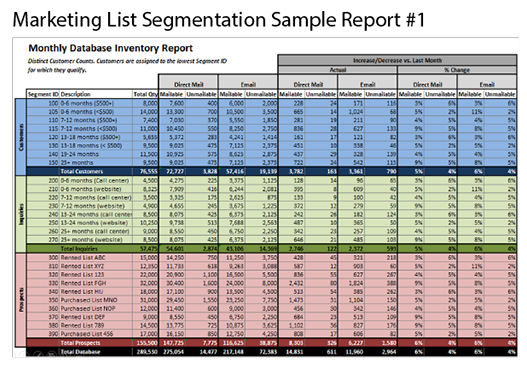
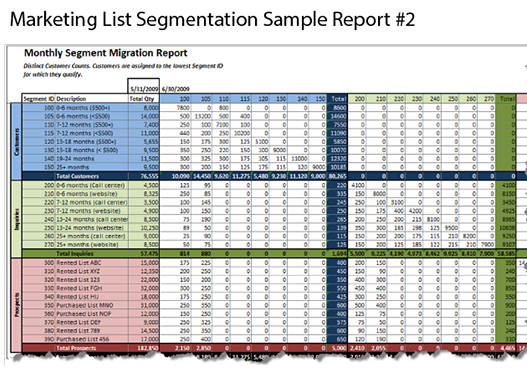
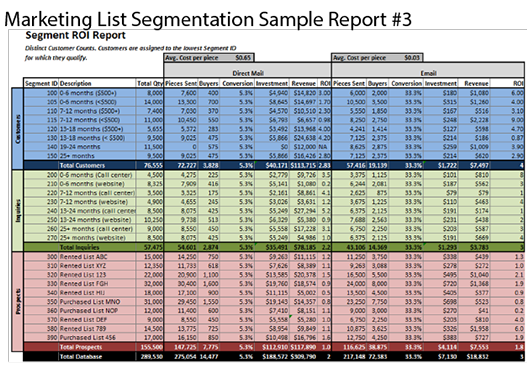
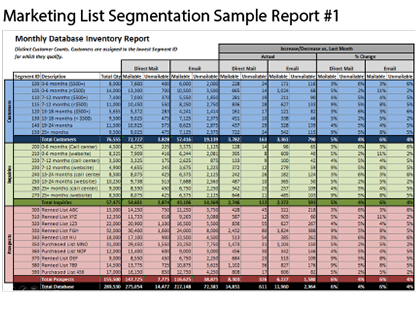
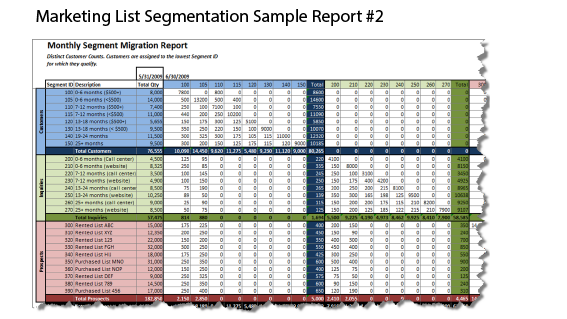
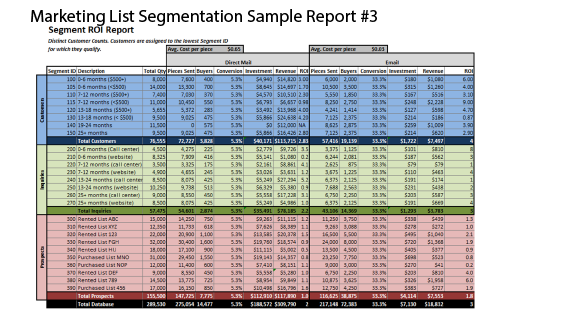
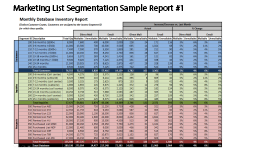
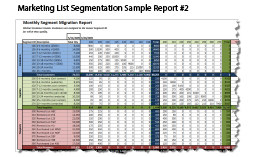
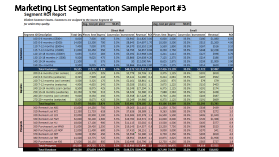
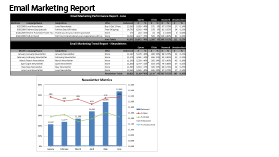
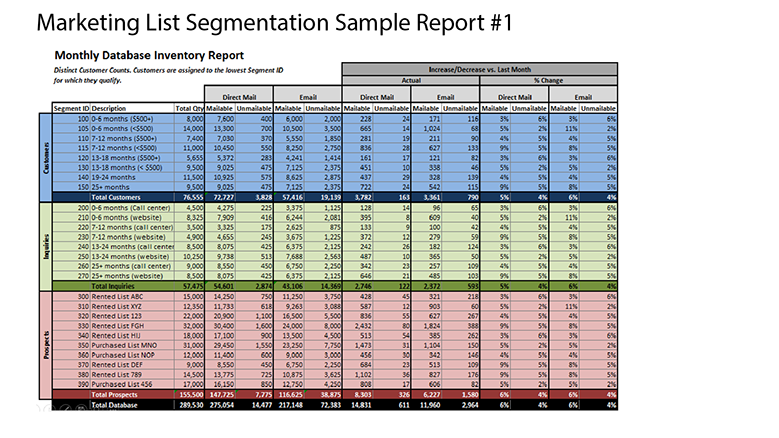
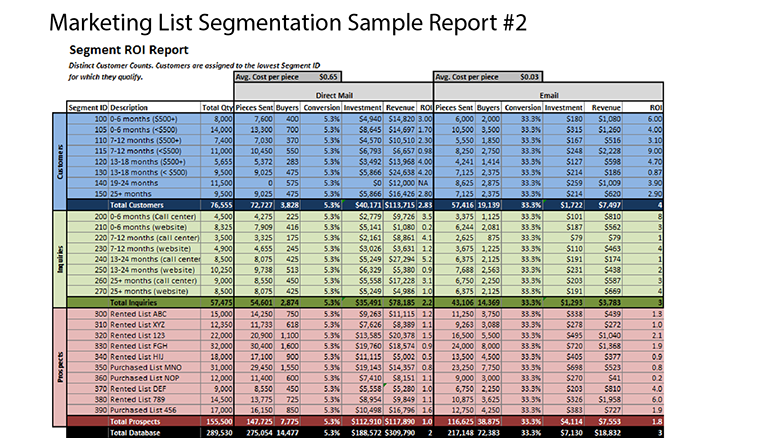
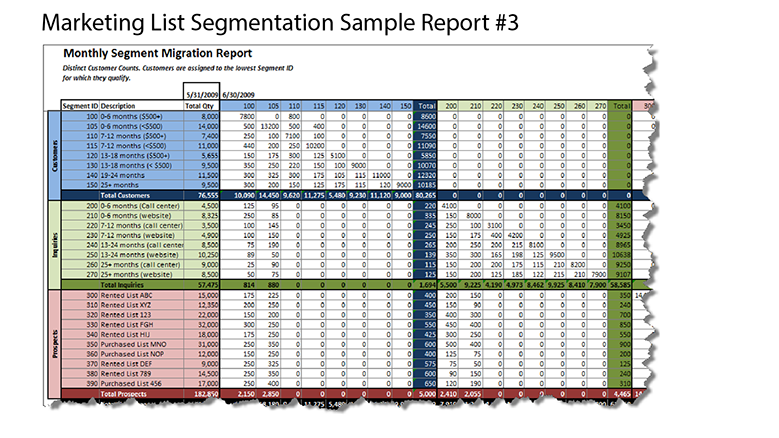
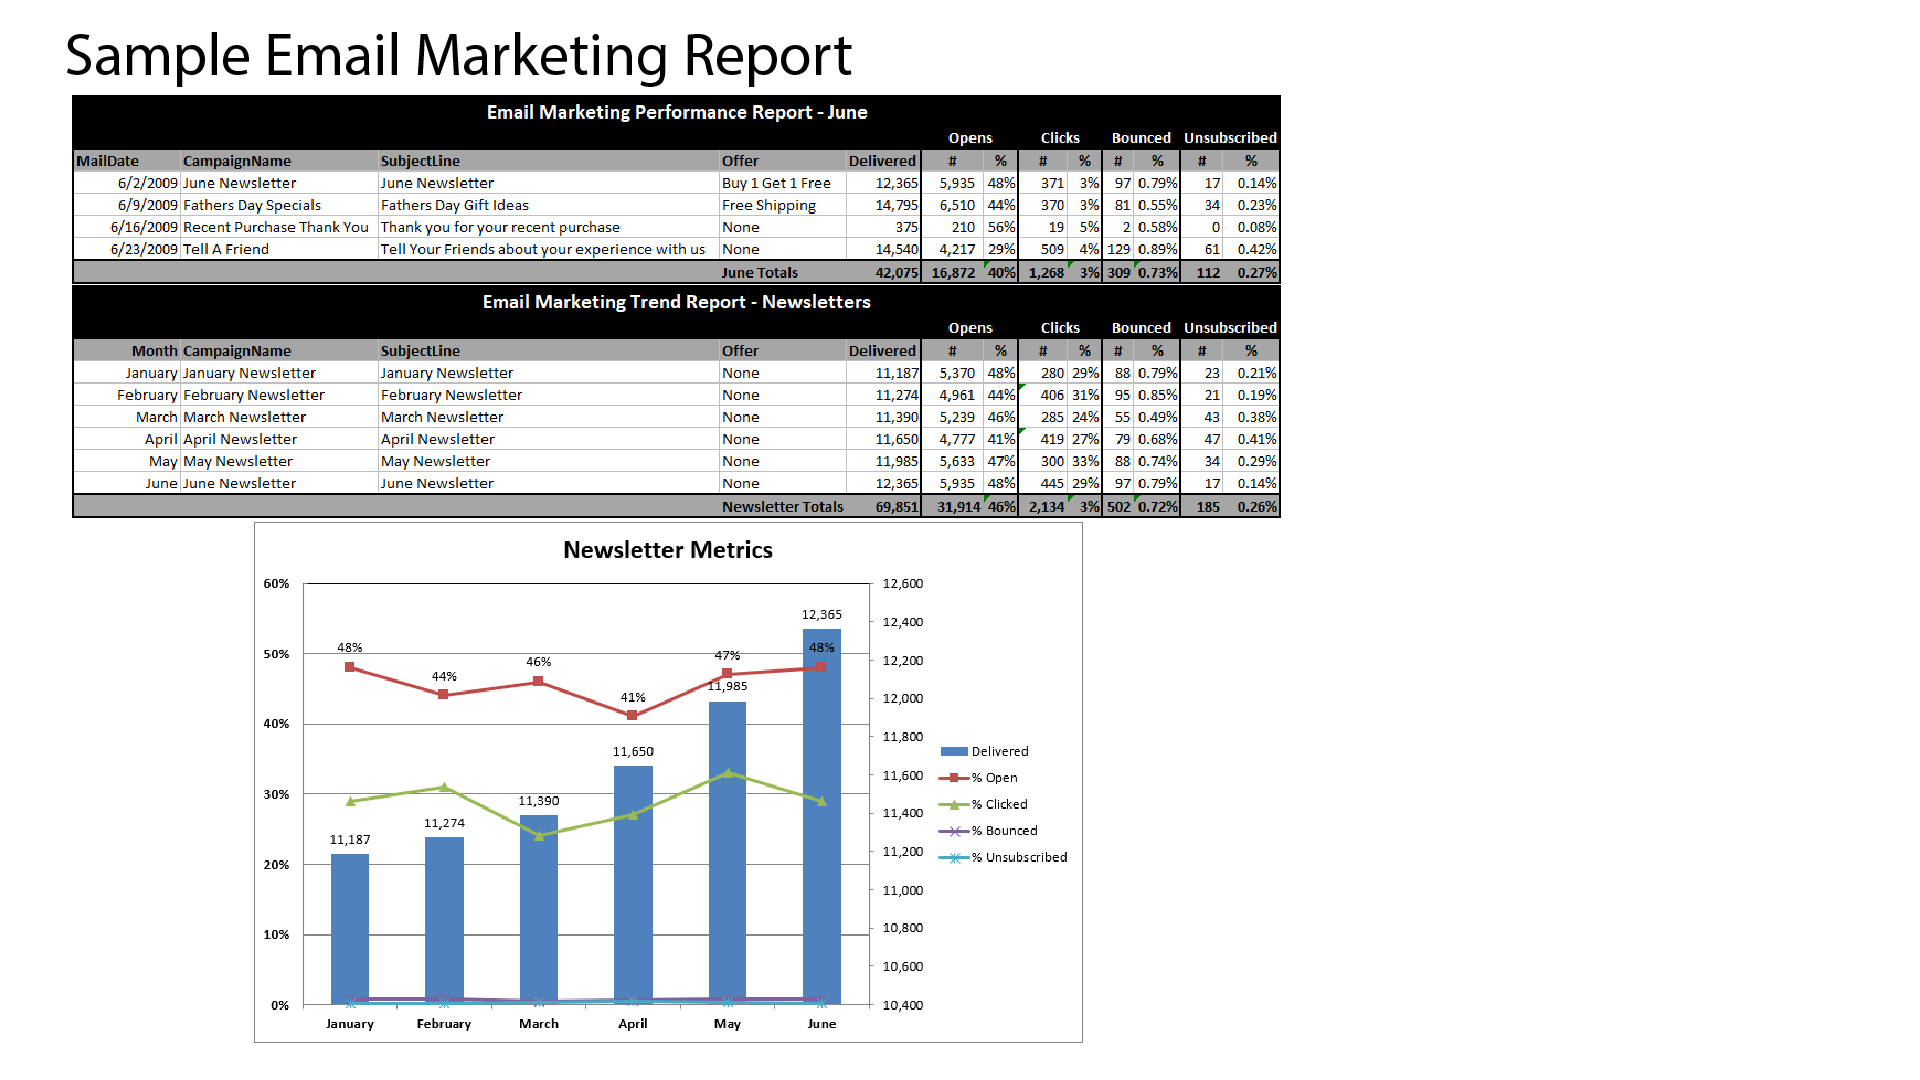
marketing campaign reporting
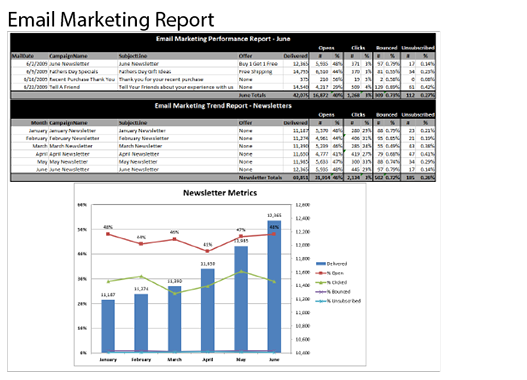
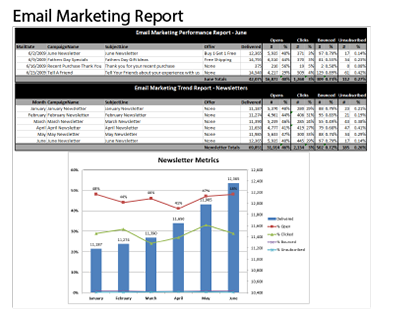
- Email Marketing
- Direct Mail Marketing
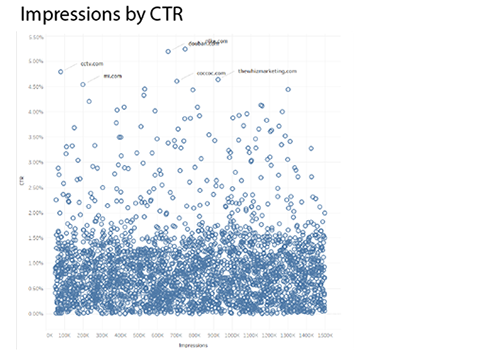
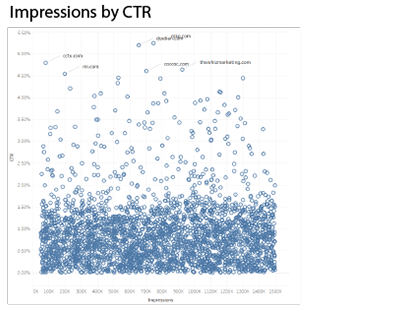
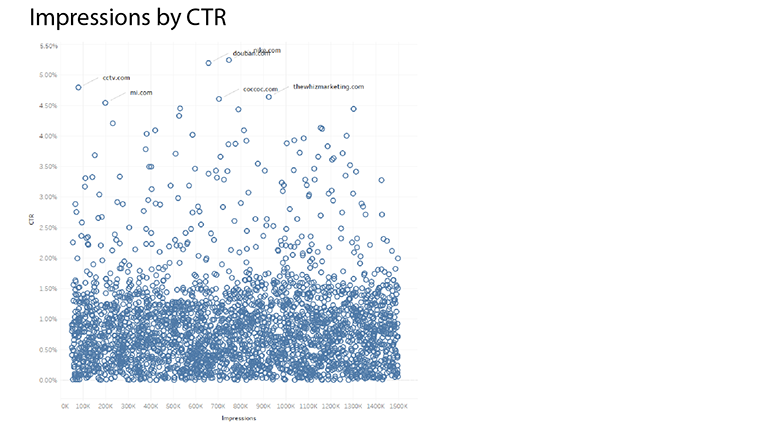
- Display Advertising
- Mobile Advertising
- Pay per Click Advertising
- etc.
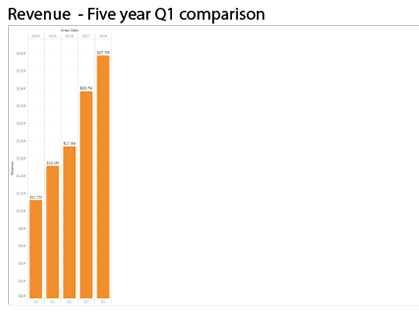
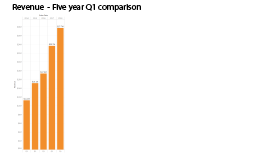
sales reporting
- Actual vs. Goal
- YTD this year vs. YTD last year
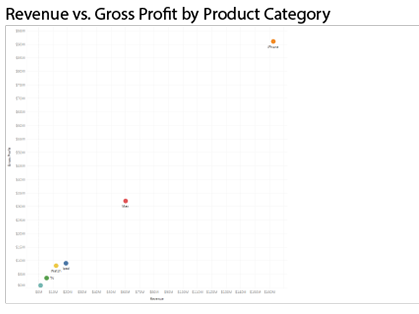
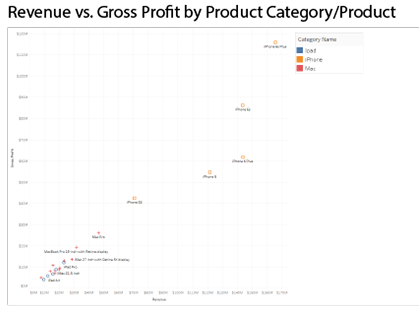
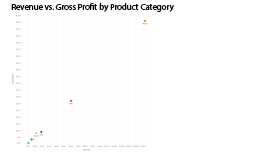
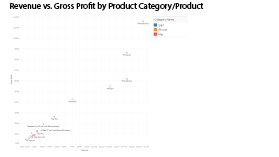
- by Product
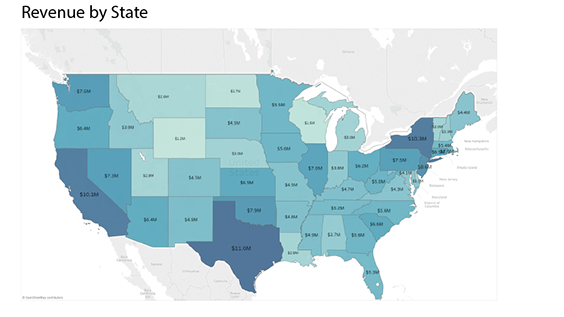
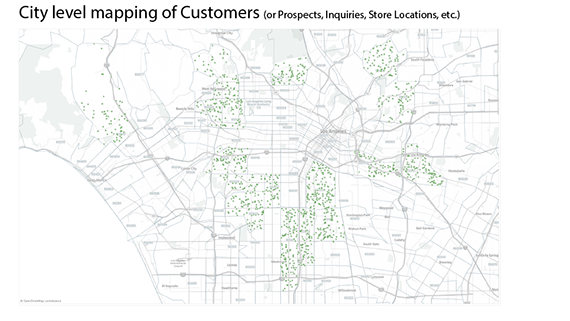
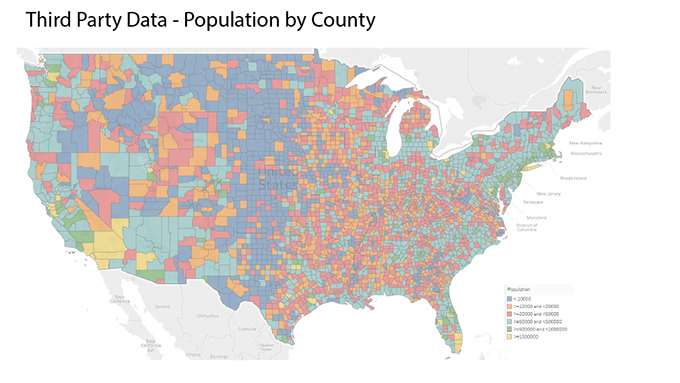
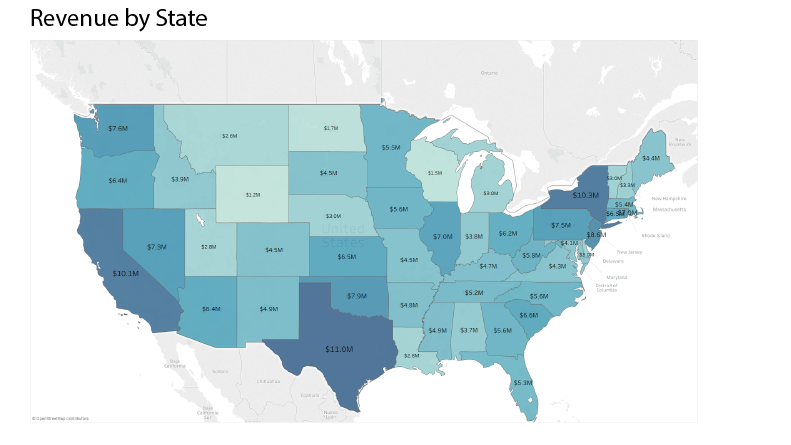
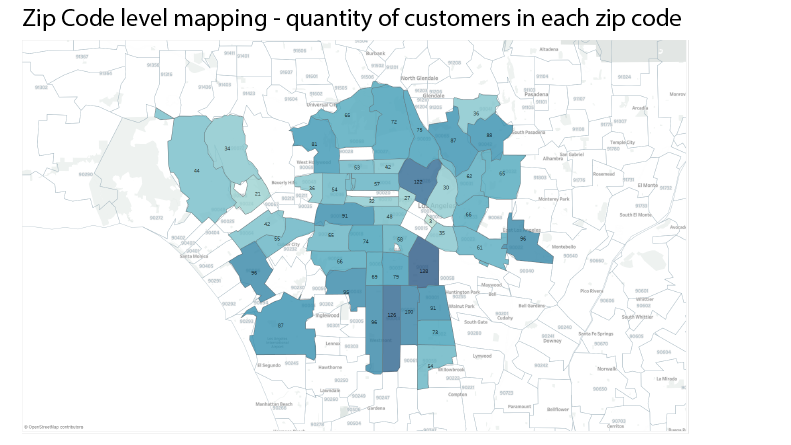
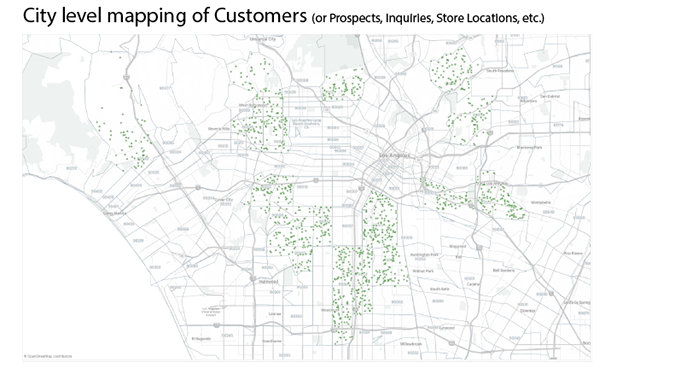
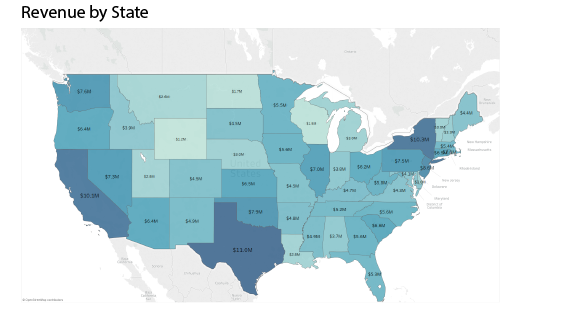
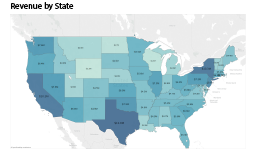
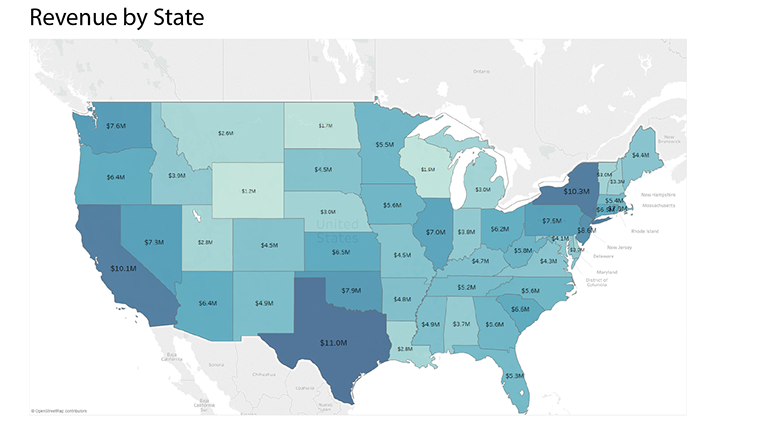
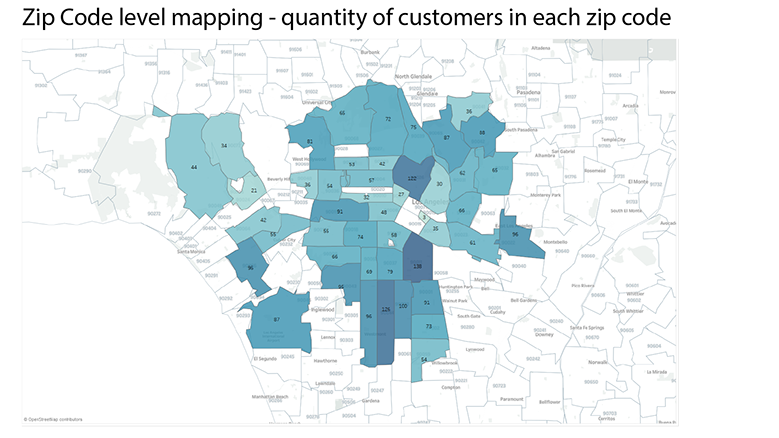
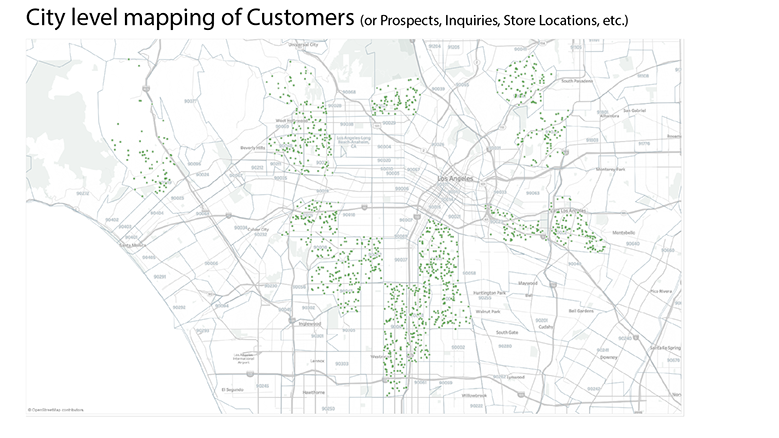
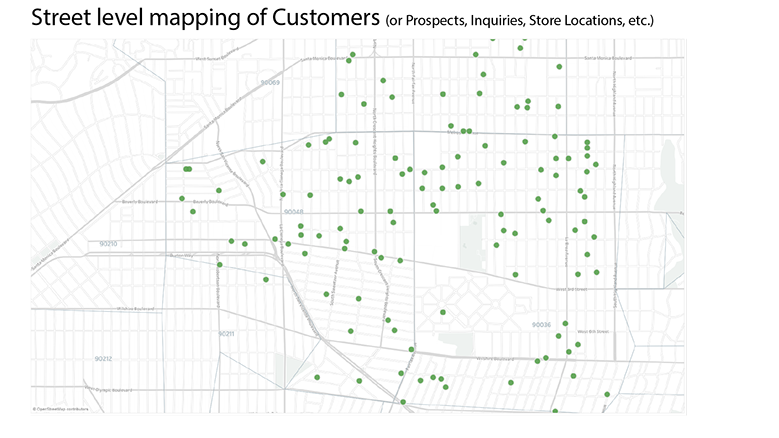
- by Territory / Geo / Location
- by Manager / Sales Rep
- by Time Period
-
Comparative Time periods
- This Week vs. Last Week
- This Month vs. Last Month
- etc.
- etc.
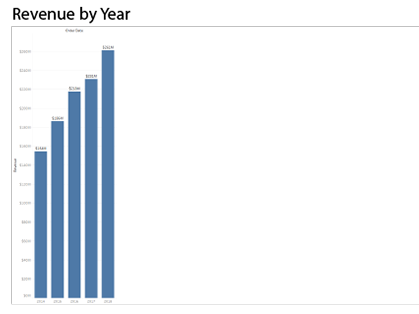
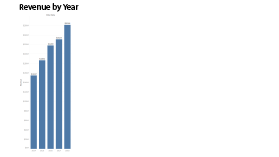
- Column
- Bar
- Pie
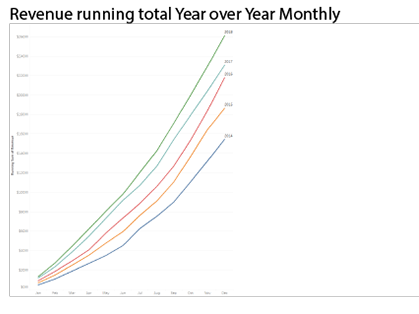
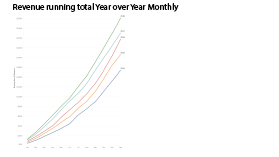
- Line
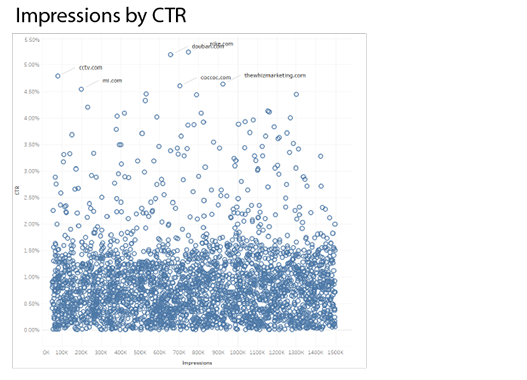
- Scatter
- Histogram
- Pareto
- Area
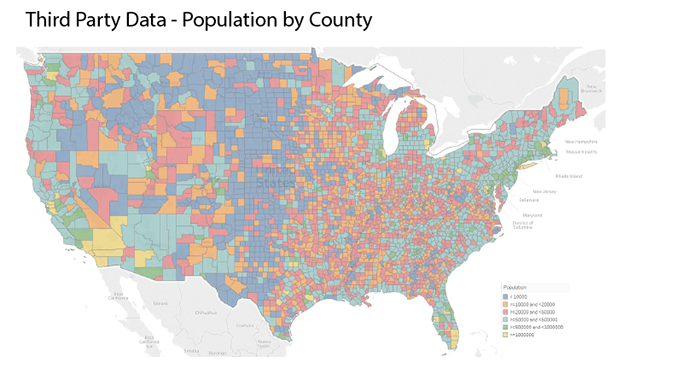
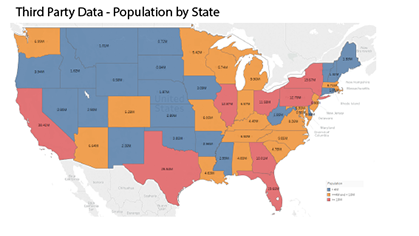
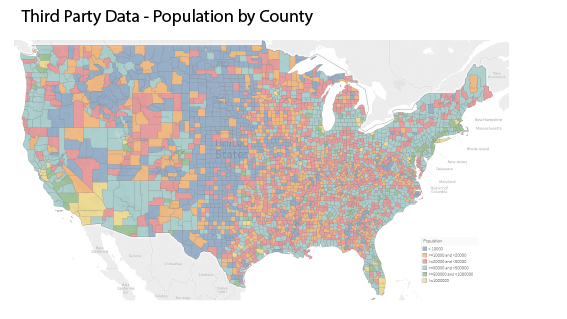
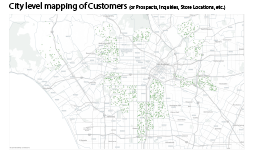
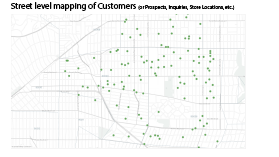
- Geo Mapping
- Stacked
- Funnel
- etc.
Who will be reviewing your reports?
- Senior management
- Sales team
- Marketing team
- Operations team
- Finance team
- Clients
- etc.
- One Time
- Annually
- Quarterly
- Monthly
- Weekly
- Daily
Regardless of how often you choose to receive reports, the reports can show daily data if that level of detail is available in your data.
in what format(s) would you like to receive your reports?
- PowerPoint
- Excel
- Microsoft Word
pricing
Every business has unique needs. We'll review your requirements and provide you with the best possible pricing.
We are confident that you will find our services to be cost effective easy to utilize.
- Fixed Pricing available
- Hourly pricing available
HOME
SERVICES
ABOUT
CONTACT
PO Box 940872, Simi Valley, California 93094
© 2017 All Rights Reserved | Privacy Policy